Brought to you in partnership with Dr James Beck of IntelligentF1.
 The conventional wisdom (by which I mean other articles) has this one as a battle between Lotus and Ferrari. Interestingly, this seems entirely based upon the long runs from Free Practice 2, so it looks like people are coming around to my way of thinking. Even more than in previous years, it is the race pace (which is not the same as the qualifying pace + fuel effect) which determines the race winner.
I must admit that it’s nice to buck the trend, and show that the analysis says something different. But it doesn’t. The red cars do look good. With Raikkonen next up.
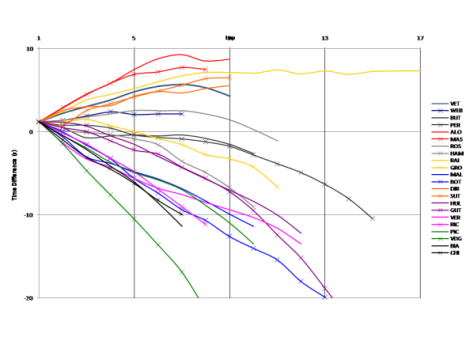
Very unusually, we have a long run from every single car. I’m not sure I have ever seen this in the two-and-a-half years I have been doing this. Not only that, but we have a second run from no less than thirteen cars. 39 runs to look at. Wow. And what do we see? Well, I’ll put the picture up for the first runs on a mock race history chart.
Last year’s first stint race pace was of the order of 100s, with Raikkonen a little faster on underlying pace. Alonso’s stint on hards is at 99.5s, which is slightly faster again. The Chinese Grand Prix ran at very similar pace (within a few tenths) of last year’s race so this pace looks to be pretty representative of a first stint. Melbourne was about 1s slower (2013 v. 2012), so I think that the teams are once again getting to grips with the tyres – although the challenge is different this year.

Ferrari are out front, with Raikkonen next, then Red Bull and (deep breath) Force India. Alonso’s run looks to be very strong (and it was on the hard tyres) and the Force Indias look great on tyre degradation. Force India were quick last week (quicker on Friday that in reality), but they look to be even better candidates for a big result this week. Raikkonen’s run suggests that Lotus may be looking at two stopping (which Force India achieved last year) and McLaren may be thinking that way too.
 Indeed the Woking cars are between the Mercedes – with Rosberg much, much faster than Hamilton. The gaps between the cars are much bigger here as well – the gap from Alonso to Hamilton in pace is 2.5s! The Marussias were only 2s from the pace in the Chinese race.
Hamilton’s pace is about that of Sauber, and ahead of Williams and Toro Rosso. But I’m suspicious of the Toro Rossos as they have been very slow in all the Friday Practice sessions so far – Ricciardo was 0.5s quicker in the race than on the Friday, and Vergne had a bigger pace gap. Let’s see if that repeats itself.
Pic and the Marussias have similar pace to Williams and Toro Rosso, and van der Garde is adrift.
But that’s not it. We have more data – a set of second runs, with Alonso on the medium tyres this time. That chart is below – but be careful as the scales are different. This time Alonso is 0.4s faster than his first stint, which suggests a similar fuel load and a reasonable guess at the race pace difference between the tyre compounds. Massa is about the same pace on each tyre.

Both the Red Bulls are faster (Vettel’s pace is about the same as Alonso’s first run), and McLaren also look better. But both Red Bull and McLaren show a much larger pace difference, which averages out to around 1 second. This is equivalent to about 12-13 laps which sounds like a first stint to me. So I would guess that teams are doing something different with the second runs. I think it most likely that gaps of 0-0.5s suggest back-to-back tyre comparisons and gaps of 0.7-1.5s are fuel load differences – the low end being for a 3 stop and the upper end for a 2 stop strategy.
So the pace which I have for each of the drivers on each of their long stints is as follows (relative to Alonso’s first stint):
Alonso 0.0s, -0.4s (tyre compound)
Massa +0.5s, +0.5s
Raikkonen +0.6s (1 run)
Di Resta +0.6s, +0.6s
Sutil +0.6s, +0.6s
Vettel +0.7s, 0.0s (second run fast – probably lower fuel for 3 stop)
Webber +1.2s, -0.2s (second run fast – definitely lower fuel, maybe 2 stop)
Button +1.4s, +0.7s (second run fast – probably lower fuel for 3 stop)
Rosberg +1.4s, +1.6s
Perez +1.8s, +0.6s (second run fast – definitely lower fuel, maybe 2 stop)
Grosjean +2.1s (1 run – miles slower than Raikkonen)(second run fast – definitely lower fuel)
Vergne +2.2s, +2.5s
Hamilton +2.5s (1 run – miles slower than Rosberg)
Maldonado +2.5s, +1.7s (fuel)
Hulkenburg +2.7s, +1.8s (fuel)
Gutierrez +2.7s (1 run)
Ricciardo +2.8s, +3.5s (fuel)
Bottas +2.9s (1 run)
Pic +3.0s
Chilton +3.2s(second run fast – definitely lower fuel)
Bianchi +3.7s
van der Garde +4.5s
 Based on this pace estimate, Ferrari look very good, with only better tyre life from Lotus (and then only Raikkonen) being likely to challenge. Force India and Red Bull look to be next up and Mercedes look to have fallen back severely at a rear-limited track. Picking up the pieces looks to be the role of McLaren and Toro Rosso.
Looks like I’m pretty much in agreement with everyone else. Never mind.

I agree that the red cars look like they are the best. The other wish I have are the Mercedes are slower than the Caterhams’s..
Now now Cav. I think you need counselling …
Seems more likely to me that Mercedes is focusing solely on heavy fuel load race simulation. Since that was their weakness in China.
That seems more likely to me than magically losing 2s of pace.
And by Mercedes, I mean Hamilton. He even said they weren’t as bad as it looked, but still alittle behind.
So everyone else was only running light fuel loads?
@ Dr James Beck of IntelligentF1.
What method do you use to assess the long run pace? Average of all the laps? or there is some other way?
It’s much more than the average of the laptimes. From previous races I have a fuel load model (it’s about 0.08s per lap here). I then produce the cumulative plots you see in the post and from the curves I can fit an average degradation for the tyres to be fair to all cars. Then I use the fuel and deg data to fit a curve to the chart – the best fit curve gives the underlying pace. I tend to focus on the second half of the curves as there is quite a big variability in the opening laps, and I have found that laps 4+ tens to fit the data from the races better. This way I can remove ‘outlier’ laps (usually traffic or mistakes) so they don’t affect the result.
I hope this helps. Ask if you want to know more. There is a description of the model and how I fit the race data on my site.
Thank you James
I have ensured we have a link to your site each time you provide us with the excellent analysis in an article.
For a detailed explanation of James model click here
By the way James, did FP3 suggest any variances from FP2 – teams did some longer runs at the start of the session
FP3 is really hard to do much with – as there is much greater variation in fuel load usually. I look for ‘first stint equivalent’ pace as this is the only fixed point for comparison. None of the data this week was in the right pace bracket (maybe except Gutierrez who was aboput 1s up on yesterday, but that may be fuel). I haven’t seen anything to shift the FP2 numbers – except that Hamilton was comparable in pace to Rosberg. I’d take Rosberg’s FP2 numbers as being better for Lewis – except that Lewis seems to be missing a few tenths.